Commercial operations commenced in June 2016 with the first post-authorisation distribution of SCENESSE® in Europe. CLINUVEL’s direct distribution model has been implemented effectively with cautious cost control. We have established a track record of positive cash flow and profitable outcomes over five consecutive years to provide a strong foundation to support the growth and sustainability of the Group.
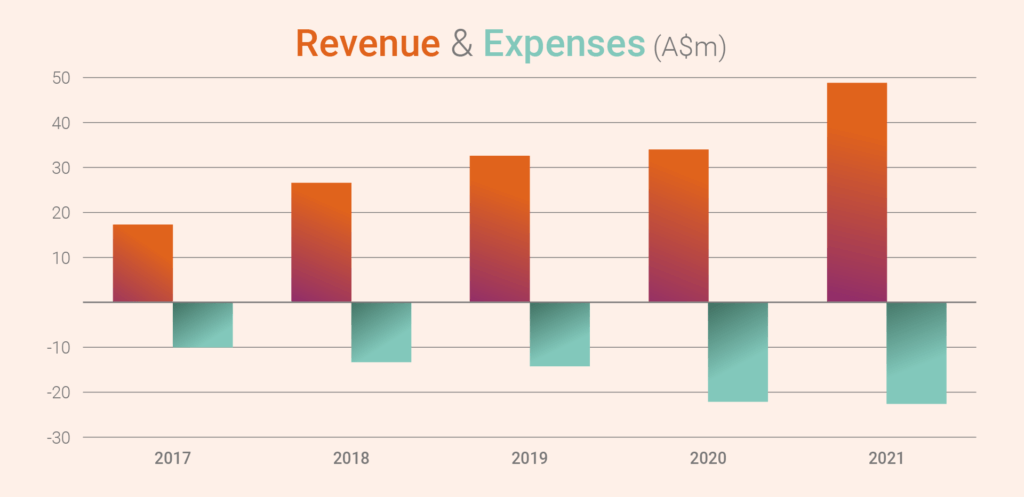
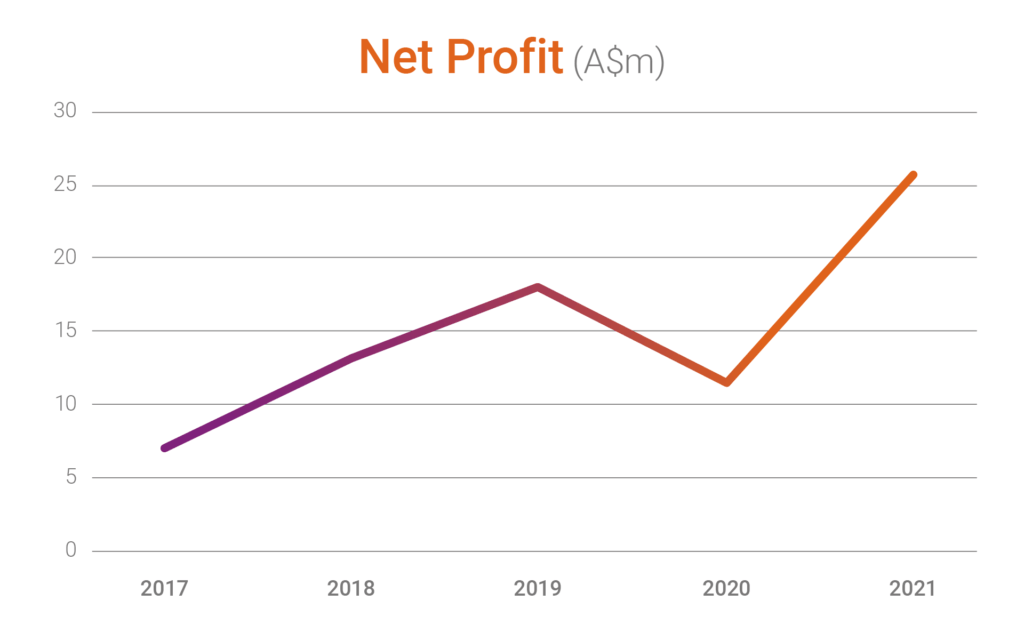
Revenues have grown over the last five years with the start of sales in the USA reflected in the 2021 outcome. Expenses have been well controlled, rising in 2020 to support key growth initiatives with an abatement of growth in 2021 due to the timing of planned expenditures on the expansion of the research and development program. A net profit for the fifth consecutive year in a difficult operating environment points to the sustainability of commercial operations.
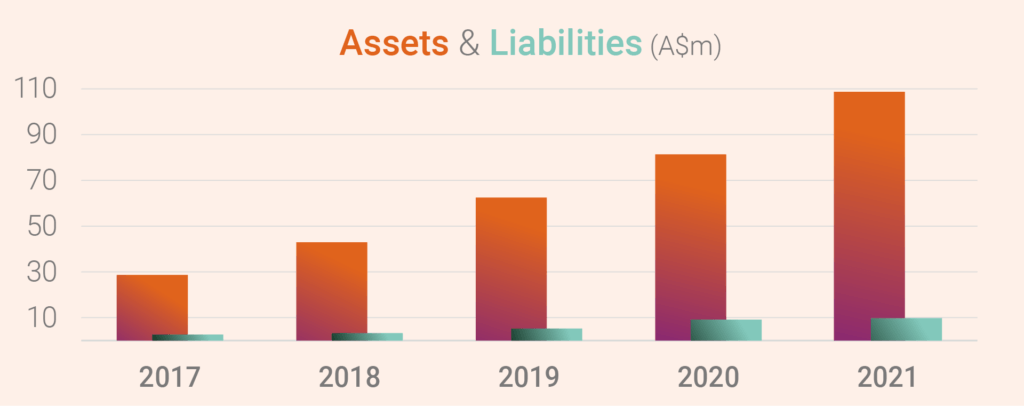
Assets have grown strongly with the accumulation of cash reserves sufficient to finance planned organic growth. Liabilities are at a minimum and are composed of trade payables and leases of operating assets.
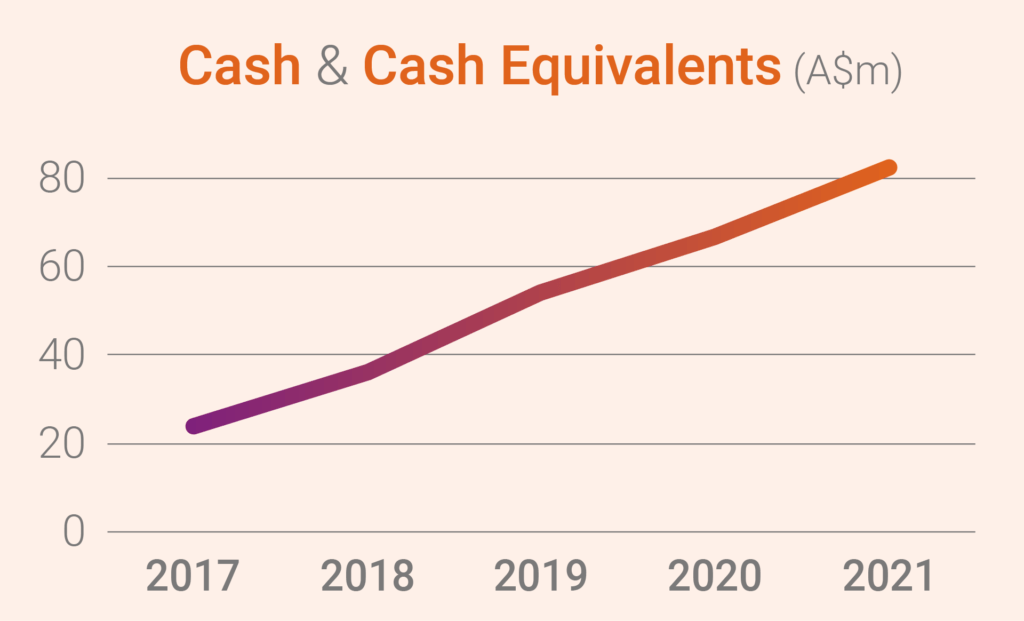
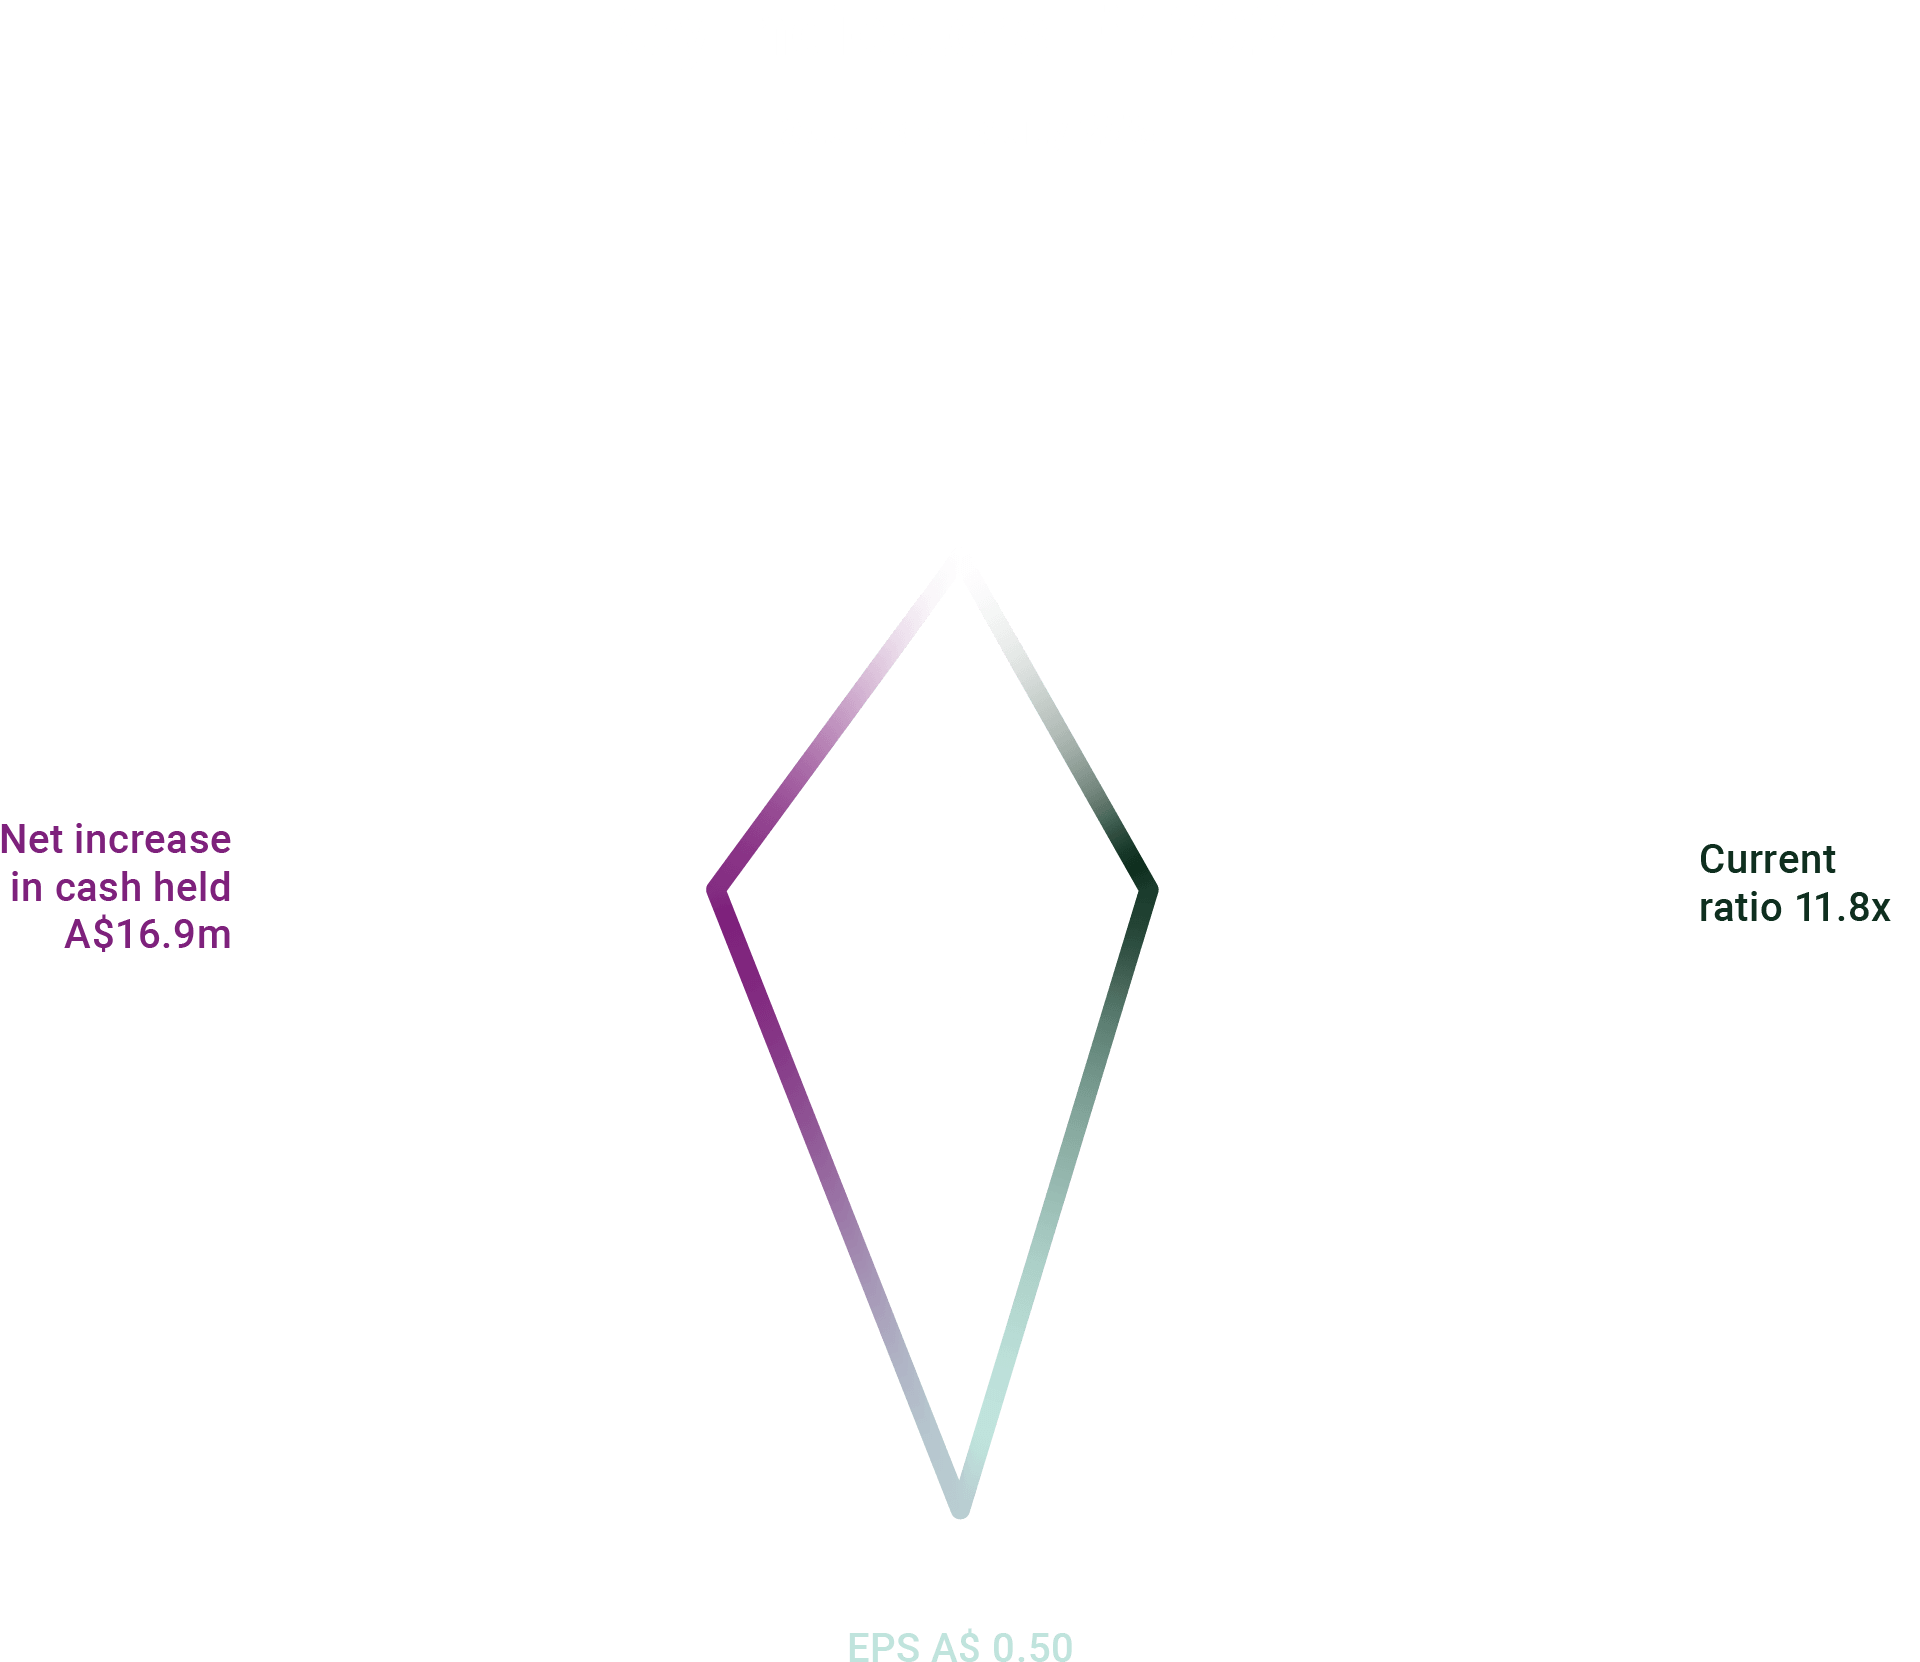
CLINUVEL’s liquidity is very strong due to high cash reserves (which make up most of the current assets), relative to modest liabilities, mainly composed of trade creditors.
Company debt is minimal, consisting of leased operating assets. There is no long-term debt.
Due to ongoing profitability, the Company’s return on equity and earnings per share are positive and are rising year on year.
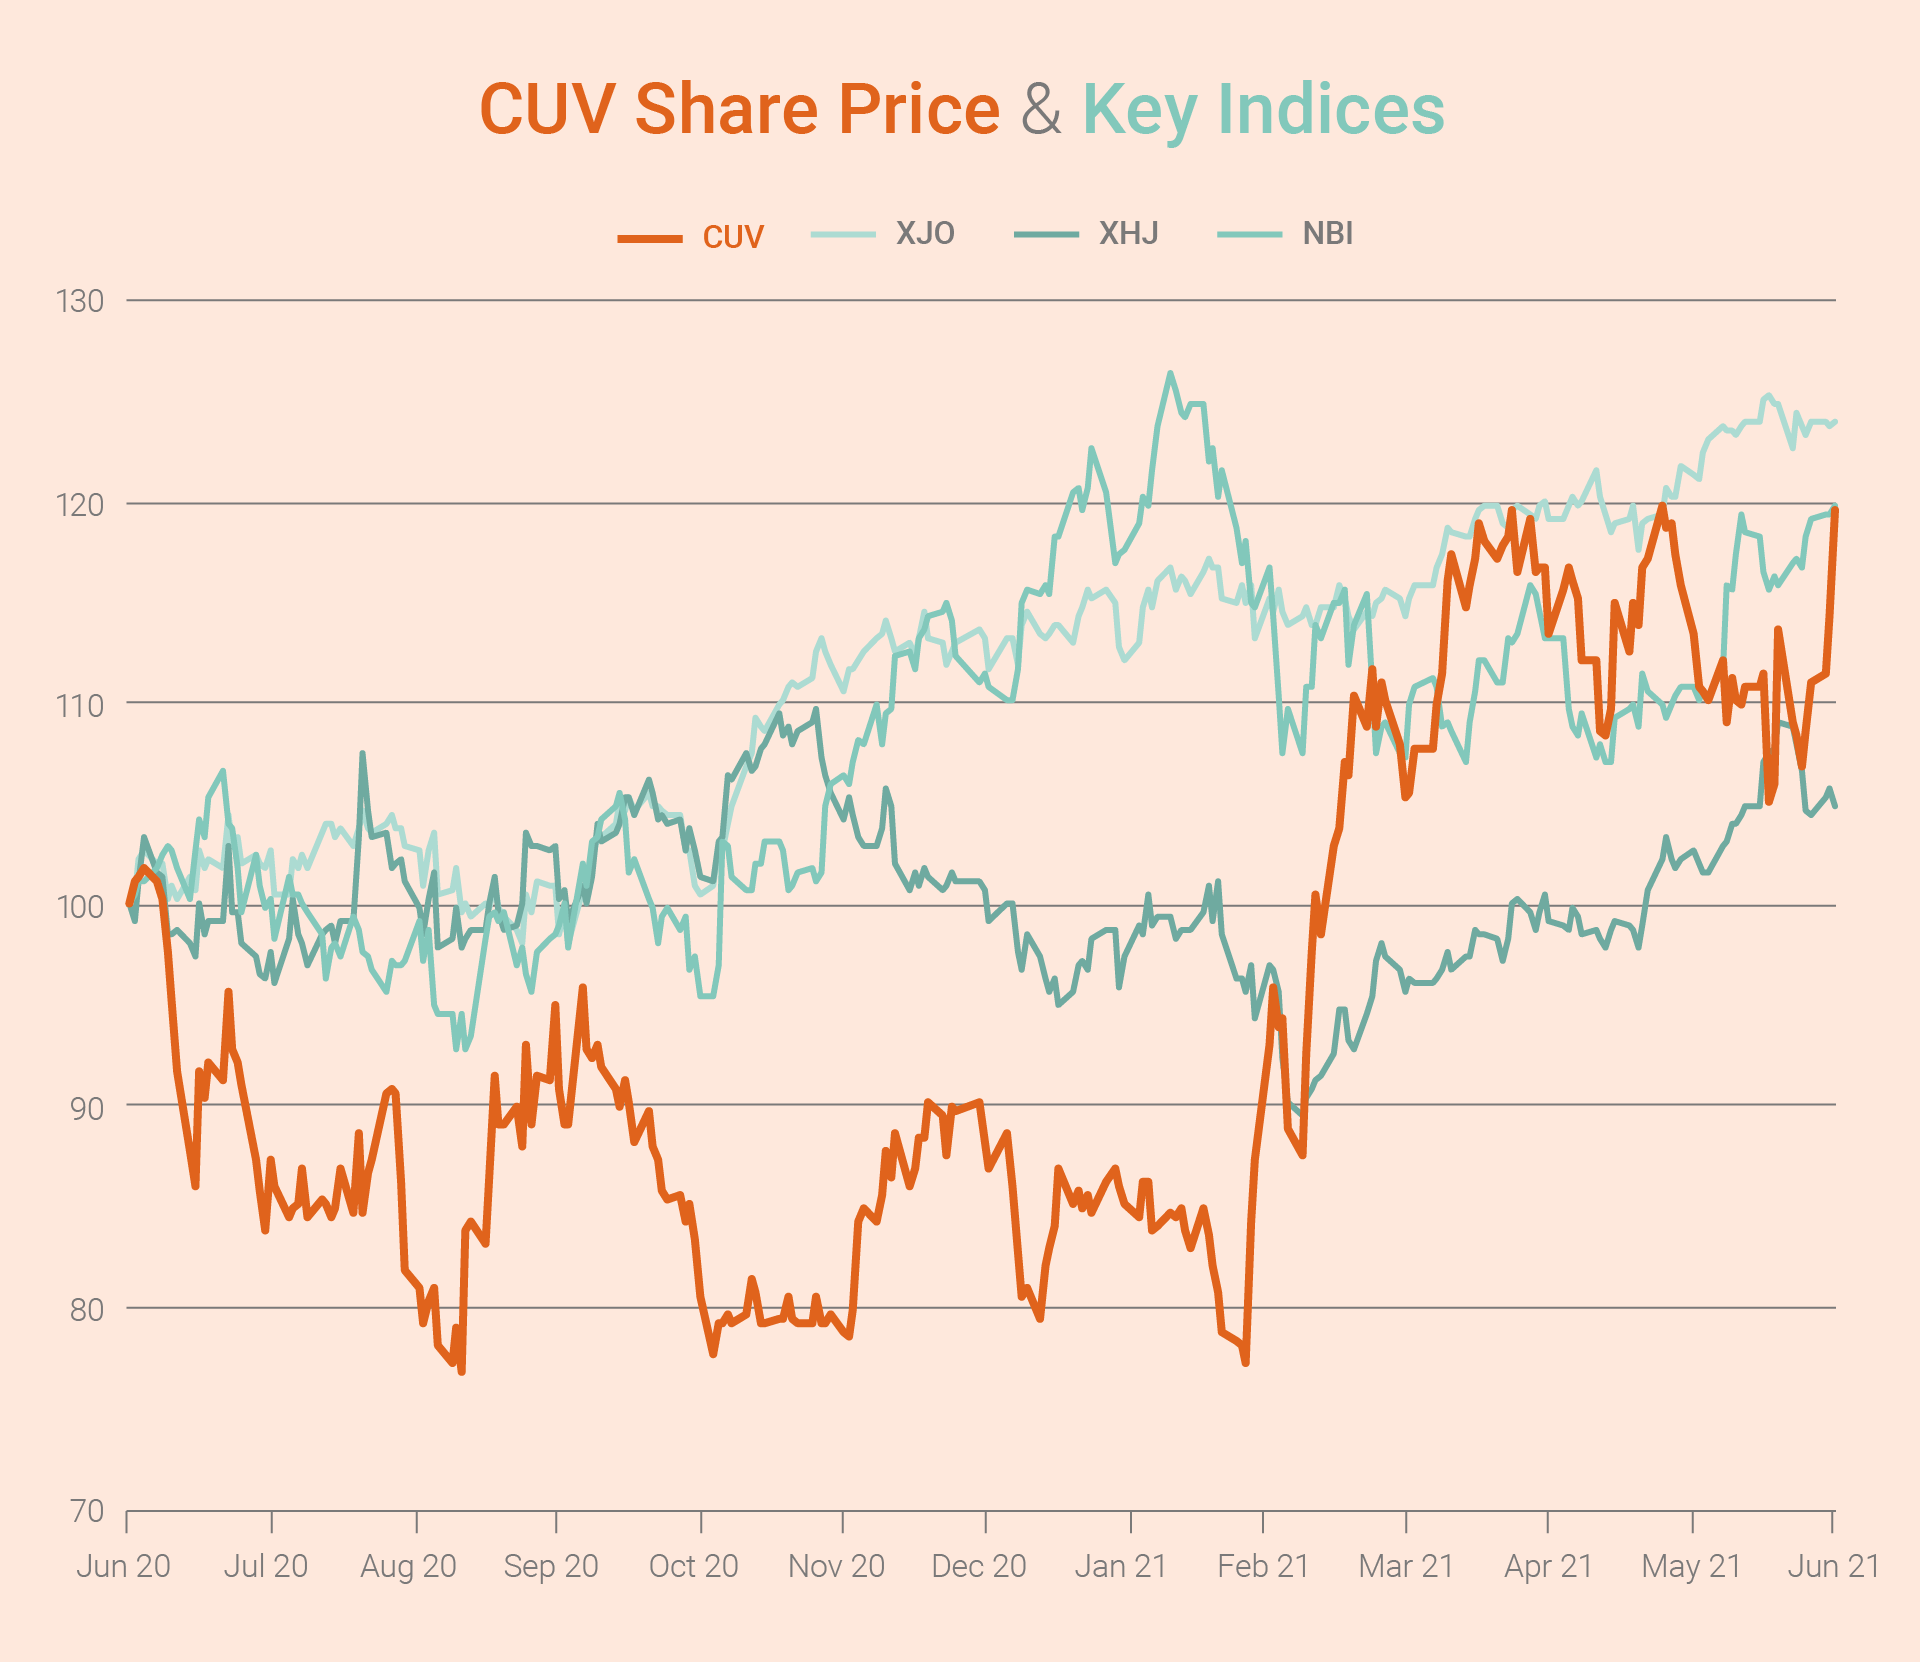
CUV’s share price trended downwards in the first half of the 2021 financial year. Following the announcement of the December 2020 half year results in February 2021, the share price rose strongly and ended the year with a rise of 19.7%. This is in line with the 19.8% rise in the Nasdaq Biotech Index (NBI) and exceeds the 5% increase in the S&P/ASX 200 Healthcare Index (XHJ). The broader S&P/ASX 200 Index of the largest capitalised listed companies in Australia rose 24% in the 2021 financial year.
The indices above are based as at 30 June 2020 = 100 to show their absolute and comparative movements during the 2021 financial year.