| Consolidated Entity | A$ million | Change |
|---|---|---|
| Total Revenues, Interest and Other Income | $82.990 | Up 24% |
| Total Expenses | $37.412 | Up 15% |
| Net Profit before income tax | $45.579 | Up 33% |
| Profit after income tax expense | $30.605 | Up 47% |
| Cash and Cash Equivalents | $156.814 | Up 29% |
| Basic Earnings per Share | $0.62 | Up 46% |
| Net Tangible Assets backing per Share | $3.29 | Up 31% |
| Dividend distribution per Share | $0.05 | Up 25% |
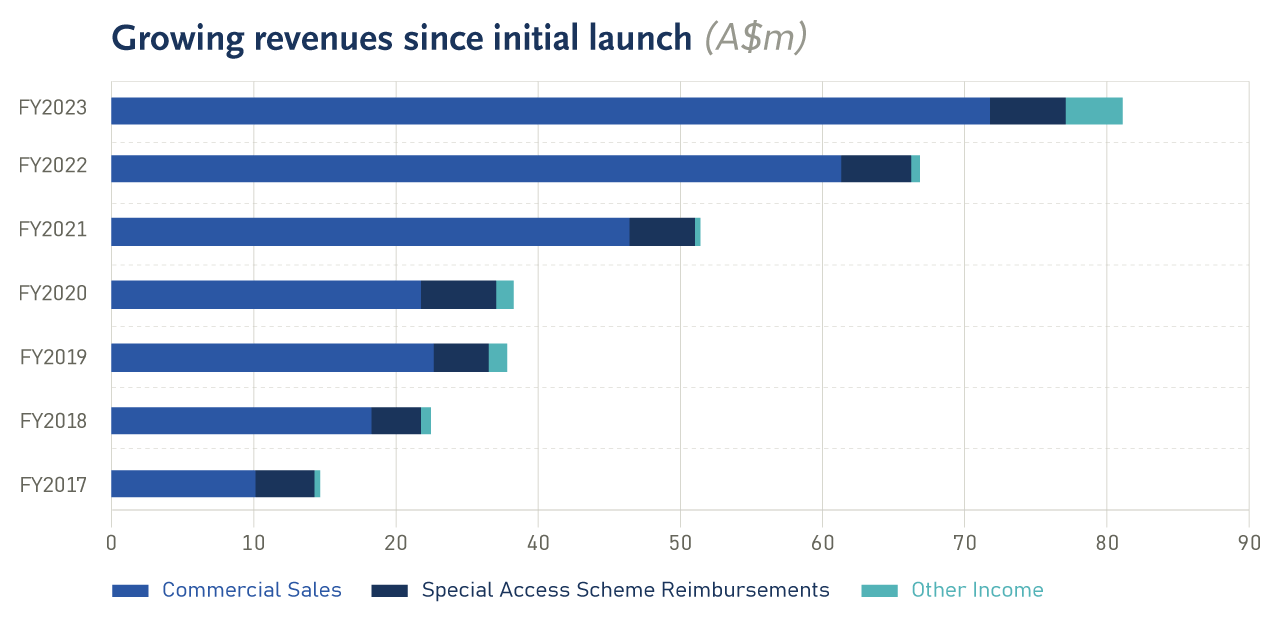
The year saw the Group increasing the number of specialist treatment centres to facilitate higher patient access and further engagement with existing centres delivering a significant 19% reported increase in revenue.
The compound annual growth rate in revenues from time of first product launch in 2016 is 42%, clearly demonstrating the sustained demand for the SCENESSE® implant over the long term. On a constant currency basis, total revenues increased 13.75%. A weaker Australian dollar resulted in a $3.562 million positive impact to the reported Total Revenue result for the year.
Total revenues include the initial pilot launch in March 2023 of CYACÊLLE, the Group’s first over-the-counter PhotoCosmetic product. Distributed firstly free-of-charge, through hospitals to patients suffering from EPP and XP1 as an adjuvant to SCENESSE®, and secondly, through a dedicated e-commerce platform to targeted audiences in six European countries. Sales from the initial pilot launch was $0.009m.
US Revenues have grown through greater patient outreach from expansion of the number of new treatment centers able to administer SCENESSE® now exceeding 50 in number. Improved geographic dispersion of centres is facilitating higher sales orders. European orders have remained robust, reflecting ongoing patient demand and more timely ordering earlier in the year having a positive impact to current year revenues.
Total revenues, including interest and other income increased by 24% in FY2023 to $83.0 million.
The growth in cash balances held throughout FY2023 were complemented by an increasing interest rate yield earned on holding interest bearing term deposits consistently throughout the year, averaging 268 basis points higher year-on-year, resulting in a robust increase in interest received from funds held in bank accounts and term deposits from $0.44 million in FY2022 to $3.90 million in FY2023.
Expenditures increased to drive R&D pipeline development, new product development; Net operating profit continues to grow
Net profit after tax of $30.6 million (FY2022: $20.9 million) reflects the performance of the Group in executing its objective to provide its novel key pharmaceutical product in an underserved market. Adjusted for various non-cash and unrealised items, the non-International Financial Reporting Standard (“non-IFRS”) financial metric of adjusted net profit after tax was $37.8 million (FY2022 $27.9 million) – refer to the reconciliation of statutory net profit after tax with adjusted net profit after tax on page 53.
Return on sales improved during the year to 58% in FY2023 (52% in FY2022) reflecting an improved rate of profitability. The stronger financial performance has been achieved despite the Group increasing expenditures to expand its product development and clinical pipeline.
Internal resource capacity has been boosted to provide the platform to support entering new markets with new products and to prepare for future operational expansion.
The Group is now three years into its five-year business expansion plan where it anticipated to commit to re-invest in its activities and to spend $175.0 million over the five years to 30 June 2025. The Total Expense result for the Group for FY2023 of $37.4 million is a 15% increase to FY2022’s total expense result of $32.7 million and is aligned with the anticipated financial commitments of the five-year plan – (refer to Plans 2024 and Beyond on page 36 for more detail).
| Commercial Sales, incl. OTC | SAS Reimbursements, Switzerland and Other | Total | |
|---|---|---|---|
| A$ million | |||
| FY2023 Reported | 72.179 | 6.142 | 78.321 |
| FY2023 Constant* | 69.027 | 5.732 | 74.759 |
| FY2022 Reported | 60.002 | 5.720 | 65.722 |
| % change (Constant) | 15.04% | 0.21% | 13.75% |
| % change (Reported) | 20.29% | 7.38% | 19.17% |
| *FY2023 revenues converted to A$ monthly at the average conversion rate of the same month of FY2022 | |||
Key expenditure items:
Personnel-related expenses were $13.58 million (FY2022: $11.59 million). Average headcount was 7% higher than last year, new roles created in Quality Assurance, in supply chain management and to bolster the newly formed Communications, Branding and Marketing division with the goal to drive the continued expansion of the business. Increases in remuneration rates were implemented to maintain market competitiveness, reflected in the employee turnover rate improving by 13% compared to FY2022.
Materials and related expenses were $12.06 million (FY2022: $5.40 million). In FY2023 a series of manufacturing campaigns were undertaken with the Group’s contract manufacturer of the SCENESSE® implant to meet imminent clinical, and term commercial demand, resulting in a significant investment in associated materials. Investment in the development and manufacture of product formulations by the Healthcare Solutions Division, in the expanded formulation development programs targeting NEURACTHEL® and PRÉNUMBRA® Instant, along with supplies and materials for the Singapore RDI Centre to progress their development of other formulations, were incurred to ensure the Group continued its path of becoming the global melanocortin leader.
Increases across commercial distribution, finance and administration, legal and insurance, and Communications, Branding & Marketing (CBM) were incurred in FY2023:
- Commercial distribution expenses were $3.15 million (FY2022: $2.49 million)
- Legal, Insurance and IP expenses were $1.32 million (FY2022: $1.15 million)
- Finance, Corporate and General expenses were $3.19 million (FY2022: $2.27 million)
- CBM expenses were $0.75 million (FY2022: $0.29 million)
The Group saw the cost of several essential activities increase throughout FY2023 as the business pursues its growth objectives. It experienced increased regulatory interaction connected to dossier changes and regulatory audits and inspections of systems including the use of external assistance to support these activities. There was increased freight, manufacturing royalties, product handling and distribution of product from higher volumes to support commercial sales and special access arrangements.
Lower insurance costs from risk protection were offset legal assistance to address several matters throughout FY2023, including the Group’s responses to various pricing negotiations in the UK, and Europe, as well as the protracted legal proceedings surrounding the breach by University of Muenster filing patent applications on technology and knowledge proprietary to the Group. The impact of heightened international staff travel across the Group, higher professional services fees, and a first-time recognition for expected credit losses arising from the US commercial distribution market, were all important factors during FY2023.
The Group has invested in resources to expand its visibility and to engage with new audiences and some of these activities included developing promotional content for the PhotoCosmetic product lines, engaging with selected ambassadors to build awareness for the need for photoprotection across digital marketing channels and conducting roadshow presentations and investor soirées to select stakeholders.
The non-cash accounting charge for share-based payments was $8.99 million (FY2022: $6.12 million). Performance rights are an effective tool in promoting employee retention and to encourage participants be aligned with the interests of the owners of the Group. In early FY2022, the Group issued 743,174 unlisted performance rights to staff of the CLINUVEL group of companies and at the end of FY2023 a further 255,750 unlisted performance rights were issued to staff. The FY2023 result reflects:
- the first full year of expensing of the FY2022 issue of performance rights, and
- reassessing the probability of achieving certain non-market conditions for performance rights held by certain staff previously considered unlikely to be met as the vesting date draws nearer.
Clinical and non-clinical development fees were $1.27 million (FY2022: $1.23 million). The deliberate increase reflects the Group’s strategy to advance its research and development initiatives into new products and new formulations as well as expanding the use of afamelanotide using new and existing formulations as a potentially new therapy for indications beyond EPP. Expense towards the DNA Repair program, investigating afamelanotide as a potential first-line therapy for XP, and the vitiligo program to evaluate the safety and efficacy of afamelanotide as a monotherapy in vitiligo patients with darker skin complexions (CUV104), were largely offset by temporary reductions in the cost of pre-clinical studies to support the Group’s strategic focus to develop new and alternative formulations and in regulatory-related fees to prepare dossier applications for review in new jurisdictions that was incurred in FY2022.
Income tax expense was $14.97 million (FY2022: $13.44 million) reflecting the impact on corporate taxes from the growth in taxable profit year-on-year. The result was aided by movements in the deferred tax position of the Australian business along with benefits received from utilising unused tax losses.
Significant growth in cash balance, maintained consistent annual spend in operating activities
Cash and cash equivalents of $156.81 million as at June 2023 (FY2022: $121.51 million), the 29% growth in cash held exclusively generated from operations and without reliance on debt or equity financing activities.
Operating cash inflows primarily consisted of receipts from the global distribution of SCENESSE® under relevant market authorisations and access arrangements of $74.88 million (FY2022: $66.4 million). Cash inflows also comprise $2.73 million from interest earned on cash held, reflecting higher yields earned from higher cash deposits throughout the financial year.
Operating cash outflows included payments to suppliers and employees of $33.23 million (FY2022: $27.35 million) and taxes paid of $7.74 million (FY2022: $Nil).
Net cash used in investing activities was $1.03 million to strengthen the infrastructure of the Group’s Singapore RDI Centre to develop novel PhotoCosmetic and pharmaceutical formulations.
Dividends distributed to shareholders during FY2023 was $1.98 million, an increase in dividends per share from $0.025 on FY2021 earnings to $0.04 on FY2022 earnings, reflecting the commitment of the Company to return value to shareholders.
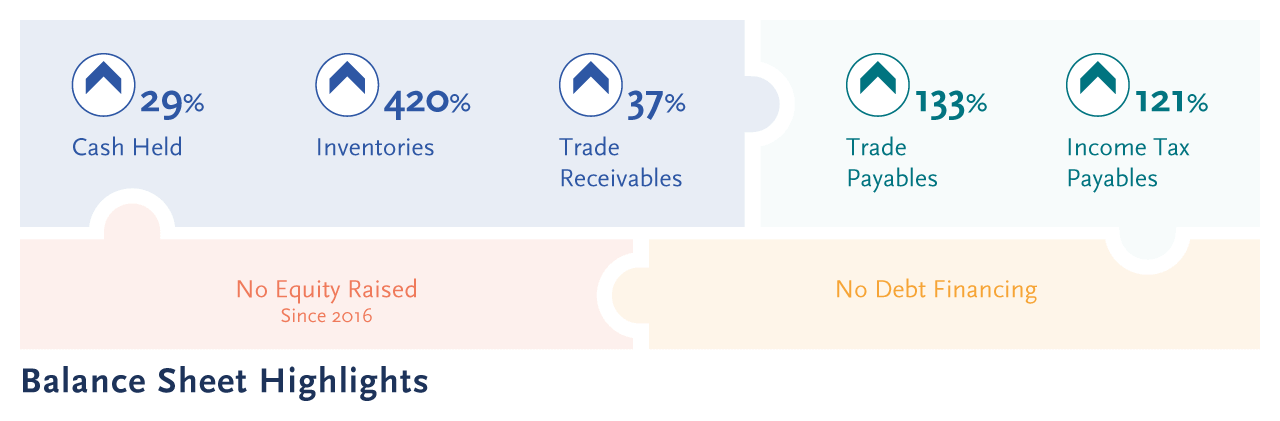
Highly liquid balance sheet, free of debt financing
A key objective of the Group is to ensure a financially strong Balance Sheet, allowing the optionality for future re- investing in the business and/or to acquire new assets and businesses to be absorbed within the Group. Additionally, a robust Balance Sheet with liquid assets provides a financial buffer to withstand unexpected adverse events. The Company has been successful to both grow and preserve its cash and cash equivalents without needing to seek further funding, and in doing so diluting shareholder returns, nor has it raised debt capital.
The increasing financial strength of the Group is reflected in the growth of its net assets to $164.6 million (FY2022: $125.56 million). The Company continues to hold no long-term debt. The ratio of the Company’s overall debt to equity increased to 18% (FY2022: 15%).
Trade and other receivables at 30 June 2023 of $22.21 million (FY2022: $16.20 million), reflect the overall growth in distribution.
Inventories increased to $9.52 million (FY2022: $1.83 million) to meet expected commercial demand and imminent clinical demand.
Trade and other payables of $7.65 million (FY2022: $3.28 million), with the increase driven by timing of payments to support product manufacturing initiatives and supply chain commitments.
Income taxes payable increased to $16.09 million (FY2022: $7.28 million), driven by a higher taxable profit result to meet Australian corporate income tax obligations as well as tax obligations in other relevant jurisdictions.